

Receptor Occupancy (RO) assays by flow cytometry are a powerful tool for evaluating the extend of drug binding to its cell surface target, but they can also be challenging to design and execute well. Here’s a quick guide to the fundamentals, the common pitfalls, and what separates a strong study design from a risky one.
What Is Receptor Occupancy?
CAR-T therapies are living, and dynamic therapies; once administered, the engineered cells can expand, persist, differentiate, and, RO assays quantify how much of a drug is bound to its target receptor, providing direct evidence of target engagement. This measure helps establish the relationship between drug exposure, target engagement, and downstream biological activity.
The RO assay can serve as a direct Pharmacodynamic (PD) measure of target engagement. However, when RO is not feasible, other PD measurements that assess the downstream biological effects of target engagement can be used. Examples include changes in signaling, cell phenotype, or cytokine production.
The two approaches are complementary, not competing. Which one (or both) you use depends on your study objectives, feasibility, and regulatory requirements.
Why Measure RO?
RO data can play an important role throughout drug development by confirming target engagement, supporting dose selection, helping interpret biomarker responses, and enabling exposure-response analyses. By linking drug exposure to target engagement, RO measurements can provide critical insight into whether a therapeutic is interacting with its intended target at levels likely to drive a biological response. For translational science teams, this information can improve understanding of variability in response and help guide key development decisions.
Why flow cytometry for an RO assay?
Flow cytometry is particularly well suited for RO measurements because it enables evaluation of target binding at a single-cell level within a heterogenous population of live cells. RO by flow cytometry distinguishes on-target binding according to discrete cell subsets and can be combined with other phenotypic or functional readouts to further characterize the target cell response.
The Three RO Assay Formats
Table 1. The Three RO Assay Formats
| Format | What It Measures | Key Requirement |
| Free Receptor | Unbound cell-surface receptors | Fluorescently labeled competitive antibody or fluorescently labeled drug |
| Free & Total Receptor | Both unbound and bound receptors | Non-competitive antibody that doesn’t interfere with drug binding (Total) and Competitive antibody that binds to the same epitope as drug (Free) |
| Bound Receptor | Drug-bound receptors | Fluorescently labeled Anti-Drug Antibody |
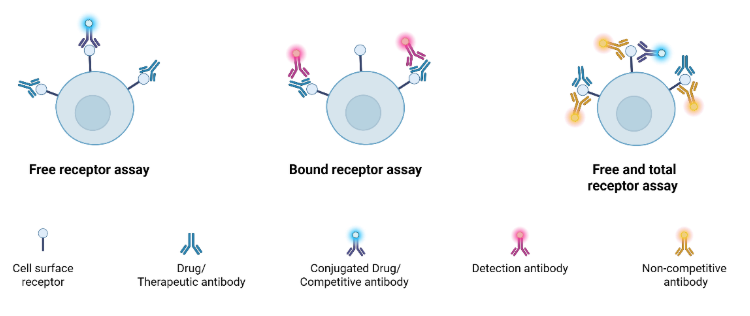
Each format answers a slightly different biological question. Free receptor assays estimate how much target remains unoccupied, bound receptor assays measure the bound drug-target complexes directly, and free-and-total approaches provide a more comprehensive picture of receptor engagement.
Why RO Isn’t Always Easy
Several factors can complicate or even prevent a successful RO study:
- Antibody availability: Anti-idiotype antibodies are often unavailable early in development; competitive antibodies may not exist commercially or may have poorly characterized binding.
- Complex target biology: High-abundance targets create background noise; low-expression targets or internalizing/conformationally dynamic targets are hard to measure accurately.
- Drug interference: High circulating drug levels can mask free receptor detection.
Sample matrix limitations: Fresh samples (or Cyto-Chex-stabilized) are the gold standard, but sample stability constraints in clinical trials can limit feasibility.
Common Failure Points and How to Mitigate Them
| Risk | Impact | Mitigation Approach |
| Reagent availability delays | Stalls assay development | Ensure access to vendors capable of custom fluorochrome conjugation of antibodies. Vendors offering reliable and expedited conjugation will minimize program delays |
| Epitope masking / matrix effects | Reduces binding accuracy | Plan to incorporate clone and matrix screening steps early during method development. |
| Inter-donor variability | Inconsistent data quality | Include sufficient donors in method development studies to evaluate potential donor to donor variability early. Consider local sample collection and rapid processing when evaluating donor variability and sample stability. Consider incorporating pre-qualification studies for disease-state samples when available. |
Factors that Influence Study Complexity
Four factors most often move the needle on both budget and schedule:
- Custom reagent development — conjugation and characterization of custom antibodies take time
- Mid-study panel redesigns — a common source of change orders and delays. Ensure full alignment on the key readouts for your assay before beginning full method development.
- Qualification vs. full validation — a fit-for-purpose approach and appropriate selection of method qualification versus method validation can save both time and budget resources. Utilize established best practices to ensure appropriate method validation (Hilt et al., 2021).
- Sample stability and logistics — may require fresh or regionally processed samples, which are accompanied by higher sample processing costs and require support from vendors with multi-region access.
Signs of a Strong Study Design
- Clear research objectives tied to the mechanism of action
- Appropriate controls and realistic timelines (including reagent and validation lead times)
- Thoughtful sample handling and data interpretation planning
- Fit-for-purpose method qualification or validation strategy is aligned with the intended context of use.
When RO Isn’t Feasible: PD as a Surrogate
When direct receptor occupancy measurement isn’t possible, PD and functional readouts can serve as strategic alternatives. Rather than measuring drug binding, measurements that are tied to mechanism of action and downstream biological changes can provide decision enabling data. A few examples include monitoring changes in selected population frequencies, absolute counts, cell proliferation, or activation marker changes. These endpoints can reflect mechanism of action and clinical outcomes without relying solely on receptor binding data, provided there’s strong biological understanding behind the approach.
FAQ
1. How do I choose between RO and PD assays for my study? It depends on your study objectives, feasibility, and regulatory needs. RO shows direct target engagement, while PD captures downstream biological effects, often the best strategy uses both as complementary data.
2. How is receptor occupancy measured? When using flow cytometry for measurement of RO, any of these three standard formats can be used: free receptor, free-and-total receptor, or bound (occupied) receptor assays. Each format provides different information on the receptor status and relies on antibodies with specific binding characteristics relative to the drug.
3. What’s the biggest reason RO assays fail or need redesign? Reagent availability delays, epitope masking/matrix effects, poor sample stability, and inter-donor variability are the most common culprits,each of which can lead to assay redesign, additional validation work, or compromised data quality if not identified early.
4. Why might full receptor occupancy testing not be feasible? Antibody unavailability, complex target biology (high background or low expression), high circulating drug levels, and sample stability constraints can all make direct RO measurement impractical.
Bibliography
To learn more about how we can support your biomarker studies, fill out the form below to speak with a scientist.