

Choosing between conventional and spectral flow cytometry and understanding exactly how the data travels from instrument to regulated reportable, has become one of the highest-leverage decisions in a biomarker program. The move to spectral flow is the most visible instrument shift of the past decade, but the harder questions live downstream: how spillover and autofluorescence are handled, how batches are aligned across a multi-site trial, how much of the analysis can be trusted to automation, and how any of it holds up under regulatory scrutiny.
At KCAS Bio, our flow cytometry team works across both platforms every day, and we help shape where the field is heading. Our Sr. Director of Cellular and Flow Cytometry Services, Adam Cotty, co-authored the 2025 Cells review on how spectral flow cytometry is reshaping the clinical landscape. Below we walk through the modern analysis workflow and what each stage means for the reliability of the data you report.
Two Platforms, One Decision
The core difference is how signals are separated. A conventional cytometer assigns one detector to one fluorophore and corrects spectral overlap by compensation, subtracting measured spillover using a spillover matrix. A spectral instrument captures the full emission spectrum of every fluorophore across many detectors and resolves the panel by spectral unmixing, fitting each cell’s measured spectrum to a library of single-color reference spectra. Two consequences follow: fluorophores with heavily overlapping emission can be used together as long as their full spectra differ, which allows for panels of 40 or more markers on a single instrument (human panels up to 50 colors have been published); and autofluorescence can be treated as its own spectral signature and removed, sharpening resolution in tissue and other high-autofluorescence matrices.
| Dimension | Conventional | Spectral (full-spectrum) |
| Signal detection | One detector per fluorophore, via bandpass filters | Full emission spectrum captured across many detectors (~48–64+) |
| Signal separation | Compensation (spillover matrix) | Spectral unmixing (fit to a single-color reference library) |
| Typical plex | ~4–18 colors; advanced instruments reach ~28–30 | 30–40+; published human panels up to 50 (OMIP-102) |
| Overlapping fluorophores | Must be distinct at emission peak | Can coexist if full spectra differ |
| Autofluorescence | Limited handling; treated as background | Can be extracted as its own signature and removed |
| Controls burden | One single-stain per fluorophore + FMOs | One single-color reference per fluorophore + unstained/AF; error propagates across the whole panel |
| Where it shines | Established low-/mid-plex clinical assays, MRD, receptor occupancy, high throughput | Deep immunophenotyping, rare-subset discovery, limited-volume samples, high-autofluorescence matrices |
| Regulatory maturity | Long-established in GxP; deep precedent | Rapidly maturing; CLSI H62 applies; growing clinical validation precedent |
Table 1. Conventional flow cytometry is not obsolete. For established low- and mid-plex clinical assays, minimal residual disease, receptor occupancy, and high-throughput work, a well-validated conventional panel is often the right and more efficient choice. Spectral earns its place when you need deep phenotyping, rare-subset resolution, limited sample volume, or clean separation in an auto-fluorescent matrix. The decision is fit-for-purpose, not fashion.
Unmixing, though, is not free, and the cost lands on controls and panel design rather than on the instrument. Because unmixing solves the whole panel at once, a poorly characterized reference control propagates error across every parameter instead of into a single channel. A high-plex panel needs one single-color reference control per fluorophore, plus unstained and autofluorescence controls, each sensitive to reagent lot, cell type, and instrument state. And panels validated on healthy donors can fail outright on disease samples, which is why validating on both normal and malignant material is now standard practice.
Autofluorescence: the Trade-off Worth Paying For
Extracting autofluorescence as its own signature sharpens resolution, but it is a genuine trade-off. As Roet and colleagues (2024) showed, autofluorescence subtraction can also increase spread in negative populations for dyes that overlap endogenous fluorescence, and mishandling it produces false-positive events. Pilkington’s 2024 commentary reinforces the point: no amount of algorithmic manipulation overcomes unmixing driven by unsuitable reference controls, and no amount of control optimization overcomes under-described cellular autofluorescence; the two have to go hand in hand. Newer 2025 approaches, including cellular-level autofluorescence matching (AutoSpectral) and formal models of unmixing-dependent spreading (Mage et al.), are pushing this further.
What this means for your samples: high-autofluorescence matrices such as solid tissue, certain myeloid and antigen-presenting populations, reward expertise, not a default button. Getting clean data out of them is a panel-design and controls problem before it is a software problem.
The Modern Analysis Workflow
Regardless of platform, once data comes off the instrument it moves through a common sequence. Where conventional and spectral differ is a single early step, compensation versus unmixing, after which the pipeline converges.
For the high-dimensional end of this workflow, a clear architecture has emerged: gate the population of interest in a validated platform, then normalize, reduce, cluster, and test. A representative published example is the pipeline from Vardaman and colleagues (2024), which performs initial gating in FlowJo and then moves everything else into Python — Z-score scaling and batch correction (e.g., ComBat), PCA and UMAP for structure, Leiden for clustering, and differential expression across groups. Scripting pipelines like this are powerful for discovery, but in regulated work the center of gravity is still validated GUI platforms like OMIQ, FCS Express, FlowJo, Cytobank, precisely because they produce the audit trails and version control that 21 CFR Part 11 requires.
That is worth stating plainly, because it is where a lot of programs get into trouble: a beautiful scripted UMAP is not the same as a validated, reproducible, audit-ready result. The two are not in opposition and the discipline is bringing exploratory, high-dimensional methods into a compliant pipeline. That bridge is where a specialized CRO earns its keep.
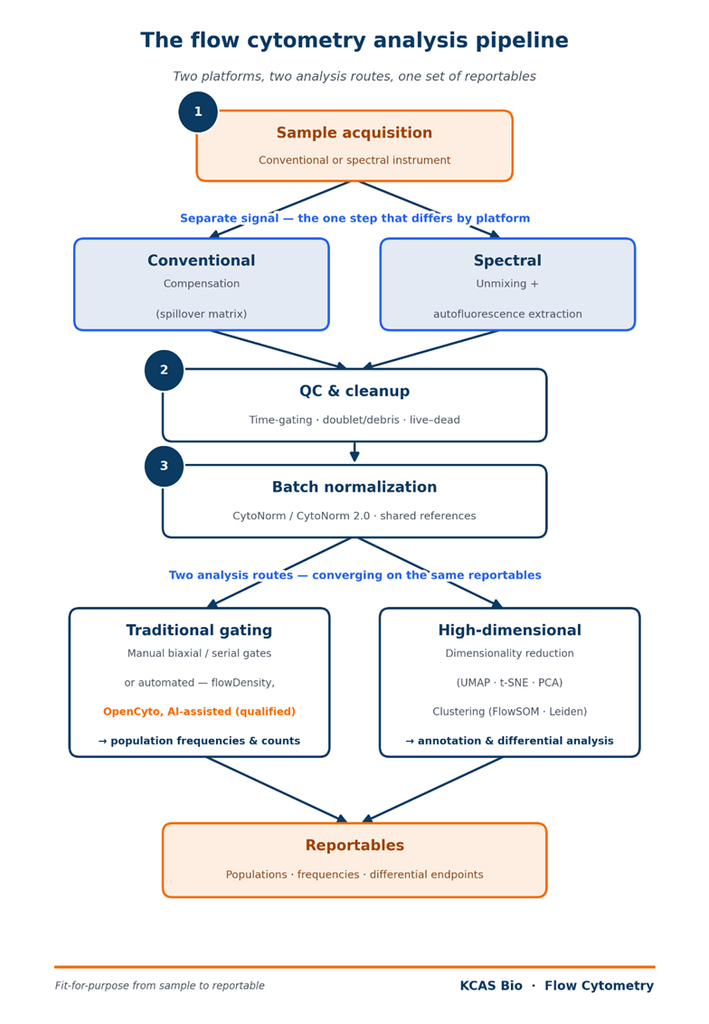
FIGURE 1. The analysis pipeline — conventional and spectral converge
Batch Effects and Longitudinal Trials
A clinical flow assay rarely runs on one instrument on one day. Samples accrue over months or years, across sites and instruments, and any drift in instrument response or reagent lot shows up as a shift in measured intensity that can be mistaken for a biological effect. Normalization addresses this directly. CytoNorm learns the transformation that aligns shared reference controls run alongside study samples, then applies it so that data from different batches and sites become comparable; CytoNorm 2.0 (2025) extends the approach to settings without dedicated controls. Instrument standardization reduces the problem before software has to; factory-harmonized spectral instruments hold voltages and settings consistent across units, narrowing the gap normalization must close. The two are best treated as one strategy, not two.
What this means if you’re outsourcing a multi-site, longitudinal study: ask a prospective partner how shared reference controls and normalization are run as standard operating procedure. In a longitudinal immunophenotyping study, that is the difference between a real pharmacodynamic signal and a batch artifact, and it is not something you want to discover at database lock.
AI is Entering the Gating Step
For years, the computational story in cytometry was unsupervised workflows that included FlowSOM and Leiden finding structure without prior labels. The 2025–2026 story is supervised and AI-assisted: automated gating and interpretation that learn from labeled examples. Recently, auto-gating algorithms have been paired with key performance indicator (KPI) metrics that score false positives and false negatives per population, letting analysts judge model quality before committing to batch processing. New toolkits such as FLAG-X (a Python automated-gating toolbox, 2026) and validated clinical systems that reduce analysis to minutes per case point to where the workflow is heading.
For a CRO, the appeal is concrete: higher throughput, greater consistency, and less of the subjectivity that manual gating introduces. But there is an equally concrete caveat; AI-assisted is not the same as unvalidated. In a regulated setting, an automated gating step is a method like any other and it has to be qualified; any modification triggers the kind of revalidation laid out by Monaghan and Eck (2025). The advantage goes to teams that can deploy these tools and validate them.
The Next Bottleneck is Data, Not Detectors
Here is the shift most panel-design conversations miss. The limiting factor for the next decade of cytometry is increasingly the data, not the instrument. In June 2025, NIST, the FDA, and NIAID convened a first-of-its-kind “AI and Flow Cytometry” workshop. Its central finding was blunt: the quality and consistency of flow cytometry data vary so widely across laboratories that millions of existing datasets are effectively siloed, unusable for training the very AI models the field is excited about. The response is a coordinated push toward AI-ready reference data, standardized reference controls, and consistent metadata.
Why this should shape your CRO decision today: the discipline that makes data audit-ready is controlled acquisition settings, characterized controls, complete and consistent metadata, version-controlled analysis and is the same discipline that makes it AI-ready. Labs that standardize now are not just satisfying today’s regulators; they are building the substrate for tomorrow’s models. Data integrity, in other words, has quietly become a competitive advantage rather than a compliance chore.
The Standards That Govern All of This
For years there was no flow-specific validation standard, and labs adapted guidance written for other platforms. That gap has closed.
| Standard / guidance | Scope | Relevance to a clinical flow program |
| CLSI H62 (1st ed., 2021) | Analytical validation of cell-based flow assays | The flow-specific validation reference: reagent/instrument qualification, optimization, validation parameters |
| Monaghan & Eck (2025), Cytometry B | Revalidation after a method is modified | Practical guidance for the common “we changed the assay” situation |
| Cossarizza et al. (2021, 3rd ed.), Eur J Immunol | Experimental design, panels, immune-subset phenotyping | The community reference for panel construction and gating |
| ICH M10 (2022) | Bioanalytical method validation & study-sample analysis | Written for ligand-binding and chromatographic assays; its principles inform regulated flow validation and documentation |
| FDA BMV guidance (2018) / biomarker context-of-use | Fit-for-purpose biomarker validation | Governs flow-based biomarker assays via a context-of-use approach |
| 21 CFR Part 11 | Electronic records & signatures | Data-integrity expectations for the electronic records a flow pipeline produces |
A GLP/GCP CRO lives inside these standards. For a sponsor, that is the practical difference between a result you can put in a regulatory submission and one you can’t.
Working with KCAS Bio
Whether your program calls for a validated conventional panel or a 40-color spectral assay, the analysis pipeline is where reproducibility is won or lost. KCAS Bio’s flow cytometry team designs, optimizes, and validates both — and brings high-dimensional and AI-assisted methods into a GLP/GCP-compliant, 21 CFR Part 11 workflow. It is the combination most programs need: the exploratory power of modern computational cytometry, delivered as data you can defend.
References
- Czechowska K, Bonilla DL, Cotty A, Dankar A, Mead PE, Nash V. Beyond the Limits: How Is Spectral Flow Cytometry Reshaping the Clinical Landscape and What Is Coming Next? Cells. 2025;14(13):997. doi:10.3390/cells14130997
- Robinson JP, Gmyrek GB, Rajwa B. Flow Cytometry: Advances, Challenges and Trends. BioEssays. 2026;48(1):e70091. doi:10.1002/bies.70091
- Vardaman D 3rd, Ali MA, Siam MHB, et al. Development of a Spectral Flow Cytometry Analysis Pipeline for High-dimensional Immune Cell Characterization. J Immunol. 2024;213(11):1713–1724. doi:10.4049/jimmunol.2400370
- Roet JEG, Mikula AM, de Kok M, et al. Unbiased method for spectral analysis of cells with great diversity of autofluorescence spectra. Cytometry Part A. 2024;105(8):595–606. doi:10.1002/cyto.a.24856
- Pilkington KR, et al. Autofluorescence: From burden to benefit. Cytometry Part A. 2024. doi:10.1002/cyto.a.24885
- Mage PL, et al. Measurement and prediction of unmixing-dependent spreading in spectral flow cytometry panels. bioRxiv. 2025. doi:10.1101/2025.04.17.649396
- Burton OT, et al. AutoSpectral: improved spectral unmixing and autofluorescence-matching at the cellular level. bioRxiv. 2025. doi:10.1101/2025.10.27.684855
- Van Gassen S, Gaudilliere B, Angst MS, Saeys Y, Aghaeepour N. CytoNorm: A Normalization Algorithm for Cytometry Data. Cytometry Part A. 2020;97(3):268–278. doi:10.1002/cyto.a.23904
- Quintelier K, et al. CytoNorm 2.0: A flexible normalization framework for cytometry data without requiring dedicated controls. Cytometry Part A. 2025. doi:10.1002/cyto.a.24910
- Martini P, Mohammadi M, Thrun MC, Blumenthal DB, Krause SW. Towards automated gating of clinical flow cytometry data (FLAG-X). bioRxiv. 2026. doi:10.64898/2026.01.10.698765
- Lin D, Gururaj A, Lin-Gibson S, Wang L. AI and Flow Cytometry. J Immunol. 2025;215(2):vkaf292. doi:10.1093/jimmun/vkaf292
- Monaghan SA, Eck S, Bunting S, et al. Flow cytometry assay modifications: Recommendations for method validation based on CLSI H62 guidelines. Cytometry Part B Clin Cytom. 2025;108(3):252–266. doi:10.1002/cyto.b.22202
- Cossarizza A, Chang HD, Radbruch A, et al. Guidelines for the use of flow cytometry and cell sorting in immunological studies (third edition). Eur J Immunol. 2021;51(12):2708–3145.
- Konecny AJ, Mage PL, Tyznik AJ, Prlic M, Mair F. OMIP-102: 50-color phenotyping of the human immune system. Cytometry Part A. 2024;105:430–436.
- CLSI. Validation of Assays Performed by Flow Cytometry. 1st ed. H62. Clinical and Laboratory Standards Institute; 2021.
- ICH M10: Bioanalytical Method Validation and Sample Analysis. International Council for Harmonisation; 2022.
- FDA. Bioanalytical Method Validation: Guidance for Industry. U.S. Food and Drug Administration; 2018.
- 21 CFR Part 11: Electronic Records; Electronic Signatures.
To learn more about how we can support your flow cytometry studies, fill out the form below to speak with a scientist.