

Quantitative flow cytometry (QFCM) is a specialized technique that enables precise measurement of the absolute number of specific molecules (e.g., receptors, antigens, or intracellular targets) on individual cells or particles. Understanding flow cytometry is essential, as standard methods typically provide qualitative data, where the relative fluorescence intensity is used to distinguish positive from negative staining. QFCM builds on this foundation by utilizing fluorescence calibration standards to convert fluorescence intensity into counts, such as molecules per cell.
This capability enables standardization across experiments, enhances reproducibility in multicenter studies, and allows accurate quantitation of biomarkers that are critical for disease monitoring. In immunology, QFCM is instrumental in tracking immune cell populations, quantifying receptor expression levels, and evaluating therapeutic responses in cancer immunotherapy and autoimmune disease research. Through the use of calibration beads and standardized protocols, QFCM provides robust, quantitative data and strengthens the reliability of flow cytometry-based assays, making it an indispensable tool for both translational and clinical applications.
In this blog, we explore the rationale behind quantitative flow cytometry, and the tools that are now being implemented to help achieve standardization.
Requirements of Quantitative Flow Cytometry
Quantitative flow cytometry enables measurement of specific biomarker(s) on or within cells in standardized units. It is typically achieved by comparing the cellular fluorescence of test samples to known fluorescent standards, allowing the derivation of units within a designated detection channel. There are two common units used to express this fluorescence quantification, (1) MESF – Molecules of Equivalent Soluble Fluorochrome and (2) ABC -Antigen Binding Capacity.
Calibration & Standardization Methods
There are several commercially available bead kits that can be utilized to establish a calibration curve for the calculation of MESF and ABC. These kits are composed of a series of beads that are either pre-stained with specific fluorophore intensities or beads that are designed to bind pre-defined levels of fluorophore conjugates. A blank is included in each kit to define the background/negative population.
There are two common forms of bead-labeling methods, (1) direct immunofluorescence which involves incubating the beads with the relevant mAb- conjugate; and (2) indirect immunofluorescence where the beads are incubated with unconjugated antibody followed by staining at the secondary antibody labeling step. The selection of bead type depends largely on the sample preparation procedure. There are several key rules to follow for quantification using beads that require mAb-labeling:
- The mAbs should always be used at saturating concentrations for both the beads and the cells. NOTE: these may be different for the beads and the cells- so titrate your mAbs on both of these!
- The same reagents, from the same vendor, and wherever possible the same lot, should be used at the same concentration across all experiments.
- The instrument fluorescent application settings should be maintained across the acquisition of the beads and all experimental samples.
Most quantitation kits leverage vendor-provided software to generate standard curves and support the calculation of ABC or MESF. The standard curve is generated by plotting the median or geo mean channel values of the blank bead and each fluorescence peak bead against the vendor-provided, lot specific, number of fluorochrome molecules per bead. When the test sample is acquired, on the same day, with the same fluorescence setting as the beads, the MESF or ABC of a target can be quantitated.
Comparison of Quantification Bead Kits
| Bead Kit | Type of Immunofluorescence | Features |
| Quantibrite™ from Beckton & Dickenson | Direct | Used with BD’s Cell Quanti Quest software. Beads conjugated with 4 levels of phycoerythrin (PE) – designed for use with PE-labelled antibodies for estimating ABC. |
| Quantum Simply Cellular™ (QSC) from Bangs Lab | Direct | 5 bead populations, 1 blank and four with increasing levels of Fc-specific capture antibody. Label with the same detection conjugate used to stain cells. QuickCal software determines the threshold and linearity of signal to calculate ABC for any monoclonal conjugate. |
| QIFKIT™ from Agilent | Indirect | Six-bead populations are coated with different, well-defined quantities of mouse monoclonal antibodies. Cells are labeled with primary mouse antibodies directed against the target of interest. In a separate tube, cells are labeled with an irrelevant mouse antibody (negative control). Cells and QIF beads are labeled in parallel with fluorescein-conjugated anti-mouse secondary antibodies. Saturation conditions are used for all staining procedures. |
| Quantum™ MESF Beads from Bangs Labs. | Direct and Indirect | The MESF beads are surface labeled with the same fluorophores used to stain cells for flow cytometry and are used to generate a standard curve of MESF. They are also used to assess the detection threshold, resolution, and linearity of detection. When coupled with a Simply Cellular bead, these can be used to determine F:P (Fluorescence: Protein) ratio and support the conversion of MESF to ABC. Available fluorophore: Alexa Fluor 488, FITC, PE, PE-Cy5, Cy5, Alexa Fluor 647, APC. |
Table 1. Features of several common quantification bead kits used in Quantitative Flow Cytometry.
Applications of Quantitative Flow Cytometry
There are several widely used quantitative flow assay kits that are approved by the Center for Devices and Radiological Health (CDRH) for clinical use (summarized in Table 2). In addition, there are many quantitative flow cytometry Laboratory Derived Tests (LDTs) with applications in the evaluation of therapeutics, along with diagnostic use and disease monitoring- several of these are described below. Most of these tests provide an MESF readout since this unit has been formally adopted by the National Institute of Standards and Technology (NIST) and National Committee for Clinical Laboratory Standards (NCCLS) as the standard measurement of fluorescence intensity.
CD34+ Hematopoietic Stem Cell Enumeration
Flow cytometric enumeration of CD34+ cells is widely employed to determine the hematopoietic stem cell (HSC) levels in cord blood-, peripheral blood- and apheresis products, and is critically used for dosing determination for transplantation. The CD34+ antigen is stage-specific and is used to identify the early stages of HSC differentiation and can be applied for the hematopoietic reconstitutive capacity of transplant products.
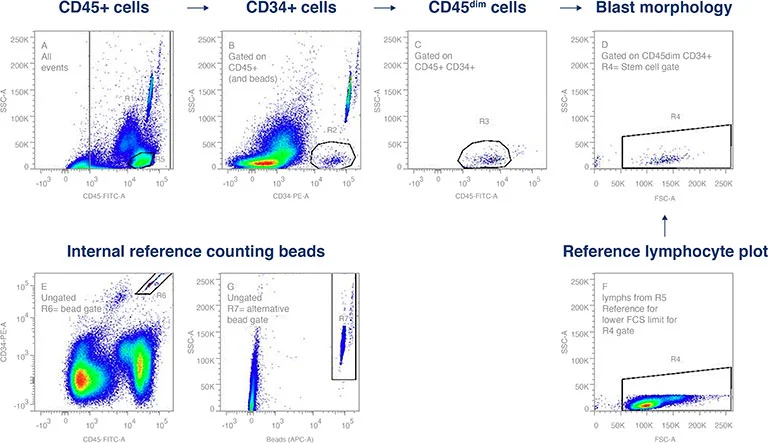
Figure 1. CD34+ flow cytometry gating strategy was established using International Society of Hemototherapy and Graft Engineering (ISHAGE) guidelines. This applies a sequential Boolean gating strategy to identify the population of interest, dim CD45 expression by the CD34+, SSlow HPC. Internal reference counting beads provide the standard for enumeration.
Quantifying B-cell Antigens
Quantitative flow cytometry has been applied for the characterization of B-cell chronic lymphoproliferative disorders (CLDs), through a comparison of surface markers on B-cells from healthy versus disease state samples. Quantitative flow cytometry of B-cell CLD-profiles for CD19, CD20, CD22, CD23, CD79b, and CD5, were shown to improve the immunological criteria for the differential diagnosis of CLDs. Furthermore, this approach was shown to be valuable for the differentiation of atypical chronic lymphocytic leukemia (CLL) from mantel cell lymphoma (MCL), and hairy cell leukemia (HCL) from splenic lymphomas with villous lymphocytes (SLVL) (D’Arena et. al. 2000). A similar comparison of quantitative CD35 levels on cell populations demonstrated the clinical value of decreased CD35 expression levels in CLL versus other CLDs- supporting a testing sensitivity of 81.8% and specificity of 88.4% for the diagnosis of CLL (Shi et. al. 2021).
Minimal Residual Disease (MRD) for Acute Lymphocytic Leukemia (ALL)
For patients with leukemias, the determination of minimal residual disease is important for assessment and long-term prognosis. For ALL, the immunological detection of MRD is hindered by the fact that leukemic cells represent the malignant equivalents of normal haemopoietic precursors expressing CD10, CD19, and terminal deoxynucleotidyl transferase (TdT). Quantitative flow cytometry has been demonstrated to be a useful tool in discriminating healthy versus malignant B-cell precursors with higher TdT (>100×103), and lower CD10 (<50×103) and CD19 (<10×103) molecules per cell compared with ALL blasts. These are critical quantitative differentiators because regenerating bone marrows display a significantly higher percentage of B-cell precursors than healthy donors, at the expense of the TdT-/CD10+/CD19+ population which has the potential to be incorrectly interpreted as evidence of disease relapse if TdT is not included in the analysis (Farahat et. al. 1995).
Quantifying T-cell Antigens in Leukemias Lymphocyte subsets naturally express differing levels of some surface antigens that are also key in identifying aberrant lymphocytes. This can create a challenge when attempting to utilize these markers for diagnostic or prognostic evaluation. Applying a quantitative approach to multiparameter flow cytometry has been important in identifying differences in antigen expression for CD3 and CD7 within healthy and disease state leukemic T-cells, enabling increased accuracy in diagnosis and prognostic evaluation (Ginaldi et. al. 1995).
Exosome & Cytokine Profiling for Clinical Applications
Quantitative flow cytometry has applications beyond immuno-profiling that extends to the interrogation of subcellular particles such as exosomes (Nolte-t Hoen et. al. 2012) and virus particles (Vazquez, D. et. al. 2018). Nanoscale cell-derived membrane vesicles are now recognized as biomarkers for several acute and chronic diseases. Flow cytometry is one of the few analytical platforms capable of assessing the phenotypic heterogeneity and quantification of these particles.
Additionally, quantitative flow cytometry plays a crucial role in evaluating cytokine receptor expression, which is essential for understanding immune dysfunction. By precisely measuring receptor density on immune cells, this technique provides valuable insights into altered cytokine signaling pathways, aiding in the diagnosis and monitoring of immune-related conditions, including renal disease (Betjes, 2013). The integration of exosome characterization with accurate enumeration further enhances their clinical relevance for diagnostic and prognostic applications.
A quantitative flow cytometry approach has been described for the interrogation of the cytokine pathways involved in the immunological dysfunction in patients undergoing hemodialysis. Many of these patients show high susceptibility to infections and malignancies and display poor T-cell responses to challenges such as vaccination. Through quantitative flow cytometry, it was determined that TNF-α was significantly elevated through the upregulation of the TNF-R2 receptor (CD120b) on monocytes and T-lymphocytes in patients on renal replacement therapy (RRT). This contrasted with the IL-2R expression between RRT and healthy control cohorts which displayed no significant differences. This level of granularity in cytokine responses in patients with RRT has resulted in more targeted therapeutic approaches to managing immunodeficiency in patients receiving intermittent hemodialysis (van Riemsdijk-van Overbeeke, I. C. et. al. 2001).
Standardized Testing & Regulatory Considerations
Table of Cleared Clinical Testing Kits
| Application | Measured Parameters | Quantitative/Qualitative | Qualification Standard Used |
| HIV Positive Patient Monitoring | CD4/Hgb | Quantitative | CD4 count/volume |
| Immunological assessment of patients with immune deficiency | CD3+, CD3+CD4, CD3+CD8+, CD3- CD19+, CD3- CD56+ and/or CD16+, CD45+ Low SS and CD45+ |
Qualitative and Quantitative | Beads |
| Assessment of CMV-specific immune status and risk of CMV-reactivation in immunosuppressed stem cell transplant recipients. | CMV-specific CD8 MHC tetramer or dextramers | Quantitative | Beads |
Table 2. Quantitative Flow Cytometry Testing Kits that are cleared by CDRH for clinical applications.
Challenges in Standardizing Quantitative Flow Cytometry
Flow cytometry is now widely used in clinical settings, and cellular enumeration is a significant aspect of the clinical workflow. However, there are still limitations, and without standardized measures of fluorescent intensity, readouts can only be expressed in arbitrary units or as dim/intermediate/bright or negative/positive. Even when implementing tools such as quantification beads, measurements made on different instrumentation formats, at different times, and in different labs, must be compared carefully.
Future Advances in Flow Cytometry Standardization
Future advances in flow cytometry standardization are set to revolutionize quantitative analysis, ensuring greater accuracy and reproducibility across laboratories. Key developments include:
- Automated Sample Preparation: Emerging technologies are streamlining workflows by minimizing human error and enhancing consistency in sample handling. Integrated, automated sample preparation and analysis significantly reduces hands-on time and improves standardization in clinical flow cytometry. Some systems enumeration for clinical application, including T-, B-, NK-cells, and CD4+ T-cells for HIV monitoring
- Single-Platform Integration: Combining acquisition, analysis, and data management into one system improves efficiency and reduces variability between instruments, making flow cytometry more accessible and reproducible.
- Advanced Innovations: Cutting-edge technologies such as microfluidic-based cytometry and AI-driven data analysis are further refining quantitative flow cytometry. These advancements enable more precise cell characterization in fields like immunophenotyping and biomarker discovery.
Technical advances and approaches such as these are helping to expand the adoption of quantitative flow cytometry across many areas of research and discovery (Maher, K. J., and Fletcher, M. A. 2005); from the study of signaling cascades through protein phosphorylation, to cellular aging through telomere length assessment, the translation of fluorescence signals into units of intensity is expanding the application of cytometry into many new and exciting areas.
Why Choose KCAS Bio for Quantitative Flow Cytometry?
At KCAS Bio, we excel in quantitative flow cytometry, offering unparalleled expertise in method validation and biomarker quantification. Our comprehensive flow cytometry services support both non-clinical and clinical studies, ensuring that each phase of your research is backed by reliable and reproducible data. By adhering to stringent standardization protocols, we achieve consistency and compliance across the duration of your project. Want to learn more? Reach out to KCAS Bio today.
References
- D’Arena et. al. Quantitative Flow Cytometry for the Differential Diagnosis of Leukemic B-Cell Chronic Lymphoproliferative Disorders. Am. J. Hematol. 64:275–281,2000.
- Shi, Y. et. al. The potential differential diagnosis value and clinical significance of CD35 expression in B-chronic lymphoproliferative disorders. Annal of Translational Medicine Vol. 9. No. 14. 2021. doi: 10.21037/atm-21-3199
- Farahat, N., et. al. Quantitative flow cytometry can distinguish between normal and leukaemic B-cell precursors. BJ Haem vol. 91, Issue 3 pp. 640-6. 1995.
- Ginaldi, L., et. al. Differential expression of CD3 and CD7 in T-cell malignancies: a quantitative study by flow cytometry. British Journal of Hematology 93, 921-927 (1995)
- Nolte-t’ Hoen, E. N. M. et. al. Quantitative and qualitative flow cytometric analysis of nanosized cell-derived membrane vesicles. Nanomedicine: Nanotechnology, Biology and Medicine vol. 8. Issue 5. Pp.712-720. 2012. https://doi.org/10.1016/j.nano.2011.09.006
- Van Riemsdijk-van Overbeeke, I. C. et. al. Quantitative flow cytometry shows activation of the TNF‐α system but not of the IL‐2 system at the single cell level in renal replacement therapy. Nephrology Dialysis Transplantation Vol. 16. No. 7. Pp.1430-5. https://doi.org/10.1093/ndt/16.7.1430
- Maher, K. J. and Fletcher, M. A. Quantitative flow cytometry in the clinical laboratory. Clinical and Applied Immunology Reviews. Vol. 5 No. 6 pp. 353-72. 2005.
- Wang L, et. al. Toward quantitative fluorescence measurements with multicolor flow cytometry. Cytometry A 2008;73:279–288