
With the rapid progress of immune-monitoring drug development, flow cytometry has found itself increasingly at the forefront of clinical trial assessment of safety and efficacy. This is not without challenges since flow cytometry analysis can be complicated and expensive, too often employs idiosyncratic experimental and analytical methods. So how can a platform without standardized methods and processes, be successfully applied to evaluate clinical endpoints? Several novel approaches to instrument calibration and experimental design are now helping to establish the harmonization of flow cytometry across multiple clinical labs. In this blog, we explore the importance of flow cytometry instrument setup and maintenance when analyzing samples from clinical trials.
Instrument Set Up.
One of the key challenges to the adoption of flow cytometry in clinical applications is the lack of standardization of instrumentation, processes, and the availability of quality control standards. Without these, labs rely on three key factors to help standardize instrument performance.
- Optimal instrument settings
- Cytometer sensitivity
- Monitoring of day-to-day variability in measurement.
Instrument optimization focuses on several key performance indicators: the power of the lasers, the efficiency of photoelectron sensing, characteristics of the filters, along with signal synchronization, and laser delay.
8-Peak Rainbow Beads bead
Maecker and Trotter published a key study on PMT voltage optimization in 2006 that utilized 8-peak Rainbow Calibration beads. The second peak of the beads was run over a range of voltages for each PMT, and a coefficient of variance was calculated for each PMT at each voltage. The result are curves displaying a deep descent where the CV decreases as the voltage increases followed by an inflection point where increasing the voltage, does not improve the CV. From this analysis, the optimal voltage for each PMT is defined as the region just beyond the inflection point. In the example below, this is between 400 and 450 volts.
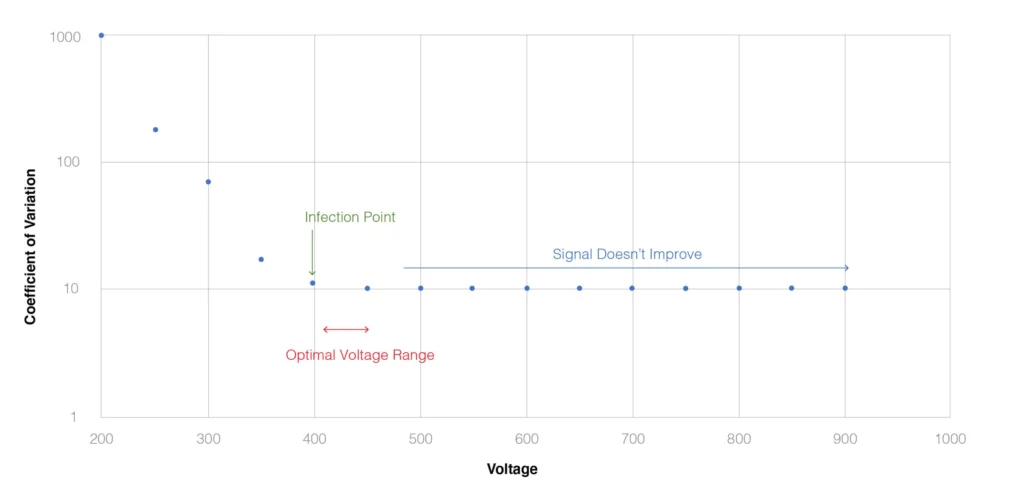
Fig. 1. Optimization of PMT using Peak 2 of Rainbow Calibration Beads, as described in Maecker and Trotter (2006 Cytometry A. 301:1037).
Each time your panel is run, the calibration bead should also be run to adjust detector voltages to ensure MFIs are maintained. It is recommended to acquire at least 10,000 single beads for QC tracking purposes.
If a panel is going to be used repeatedly over time such as for a clinical trial, the optimal voltage may be refined by performing a voltage titration experiment using stained cells.
BD CS&T Beads
Beckton Dickenson cytometers are supported by a Cytometer Setup and Tracking (CS&T) system consisting of standardized beads and a fully automated software that provides characterization and definition of instrument baseline performance, optimization, and standardization of cytometer setup and tracking of instrument performance. CS&T beads are essentially a 3 peak bead system with the dimmest bead being smaller than the other two fluorescence enhanced beads. The CS&T System automatically checks and adjusts laser delays and area scaling factors, adjusts the detector PMT voltages to place bright beads at their target values within each PMT detector. The dimmest beads provide the most significant contribution to the CVs and therefore contribute the greatest to ensuring the resolution of dimly fluorescent populations from unstained populations.
The CS&T system provides several benefits from consistency and reproducibility of instrument performance as well as help track the performance of the instrument over time. This can be particularly important for the consistent performance of multicolor panels and helping to offset day-to-day instrument variability. CS&T can also be applied to standardize between instruments and sites and can provide easy identification of degrading cytometer performance regarding fluidic instability, signal noise due to imperfect cleaning, or faults within the optical system (laser or PMTs).
An important consideration is instrument warm-up time for flow cytometers this may be as long as two hours, depending on the types of lasers. It is therefore recommended that control beads be run both at the start and at the end of the experiment to detect any performance issues that might take place over the course of the run.
Monitoring Instrument Performance
Time as a parameter can be useful to monitor the stability of the flow cytometer and detect problems with lasers and detectors. It can also help demonstrate that the flow stream is stable – without a stable flow stream, good flow cytometry can not be achieved. Tracking time, can provide visualization of increasing backpressure and reduced flow, and time gating can be valuable in removing blocks of suboptimal data from your analysis. It can also be applied to visualize kinetic changes within the sample, such as changes in viability over time within a sample
Levey-Jennings plots can be critical in tracking all cytometer performance parameters including detector efficiency, background, rCVs, and PMT voltages day-to-day.
The Art of Flow Cytometer Cleaning
Flow cytometers are very robust instruments, as long as they are cleaned and well maintained. Cells, DNA and protein can all be sticky, and residual build-up over time can create clogs and disrupt the flow stream. It is always good practice to filter samples before loading on the cytometer to remove cell clumps, however even with this step, cleaning the instrument is critical. A five-minute rinse with FACS Clean (1% bleach), FACS rinse (Detergent) followed by a long rinse in deionized water is typically used, and even during an experimental run, rinsing with FACS Rinse can help prevent clogs, especially with sticky samples or tissue preparations. As part of daily maintenance, keeping the SIP in a sample tube with water will also help ensure that sale crystals do not form that could lead to clogging.
It is important to rinse well with water after a bleach wash since residual bleach can reduce fluorescent signals from conjugates. We also recommend extended washing after the acquisition of samples using DAPI, PI, or 7AAD. Never use DMSO or similar solvents to wash an instrument since these may damage the flow cell.
A dirty cytometer can generate noisy data, so a long system clean should be employed once a week- this process can take as long as 2 hours for some instruments. Deep cleaning protocols have also been developed that flush out the fluidics system with strong oxidizing solutions such as 50mM sodium hydroxide, 70mM sodium hypochlorite, followed by and acidic solution such as 10mM acetic acid, and a final long flush with deionized water and sheath fluid. This type of clean can dislodge and flush our cellular debris and particles that are not removed even during the long clean process.
If lines become contaminated, particularly those of cell sorters, then decontamination can be achieved using a fresh1% hydrogen peroxide solution, 1% sodium hypochlorite or 70-80% ethanol, followed by deionized water.
Final Thoughts
Robust instrument maintenance needs to be carefully planned and processes strictly adhered. Investing time in training to ensure consistency in these practices between labs and personnel will pay off in mitigating instrument performance issues. Daily maintenance can be supported using calibrated beads such as Beckton Dickenson’s CS&T beads, that help ensure any issues are detected before sample runs and enable Levey-Jennings plots to track drift in instrument performance over time. Since high-quality clinical flow cytometry can only be achieved on well-maintained instrumentation, investing time, effort and best practices to all aspects of instrument set up and maintenance are essential to any clinical flow cytometry lab.