

With the rapid progress of immune-modulating drug development, flow cytometry has found itself increasingly at the forefront of clinical trial assessment of safety and efficacy. This is not without challenges since flow cytometry analysis can be complicated and expensive, too often employs idiosyncratic experimental and analytical methods. So how can a platform without standardized methods and processes, be successfully applied to evaluate clinical endpoints?
Several novel approaches to sample processing, panel design and instrumentation standardization are now helping to establish harmonization of flow cytometry across multiple clinical labs. In this blog we explore the important of flow cytometry data analysis and how the need to understand increasing complex data sets has driven the development of new algorithms and visualization tools to help ensure robust, and objective interpretation of clinical samples.
Background
Tremendous advances in flow cytometry technologies and reagents used in flow cytometry analysis have been made over the last decade, enabling more parameters than ever to be clearly resolved on single cells, with higher speeds and efficiency than ever before. The result is larger and more complex data sets which can be challenging for existing tools to manage efficiently and effectively.
Flow Cytometry data analysis begins with the computational determination of the intensity of fluorescent signals from fluorophores used to label specific biomarkers on each cell. Fluorescence compensation is used to subtract overlapping fluorescence to ensure the signal recorded by each detector represents the intensity of its target fluorophore. This data is captured in the form of Flow Cytometry Standard (FCS) files; a binary file format with 3 main segments recording meta data keywords, a matrix of detected expression values and an analysis segment. Compensation is achieved using software either on the instrument, or during the analysis if the FCS files.
Conventional flow cytometry analysis employs gates to define regions within single and bidimensional plots. Experienced analysts can employ these strategies to identify subpopulations of interest and measure biomarker responses. However, as the number of potential parameters measured on each cell increases, extracting data from these plots becomes increasingly complex and time consuming. The real challenge involves removing the limitations of the intuitiveness of the data analysis and in the development of mining tools that can extract relevant differences between subpopulation profiles and their functional expression markers in both an objective and reproducible manner.
There are now several automated gating platforms that use statistical analysis to delineate subsets within a given dataset. When applied iteratively, this process enables the sequential definition of the subsets in much the same way as manual gating would, but instead of the application of gates, the boundaries between subsets are defined mathematically. The result of sequential iterative selection can be expressed in the form of a branches analysis.
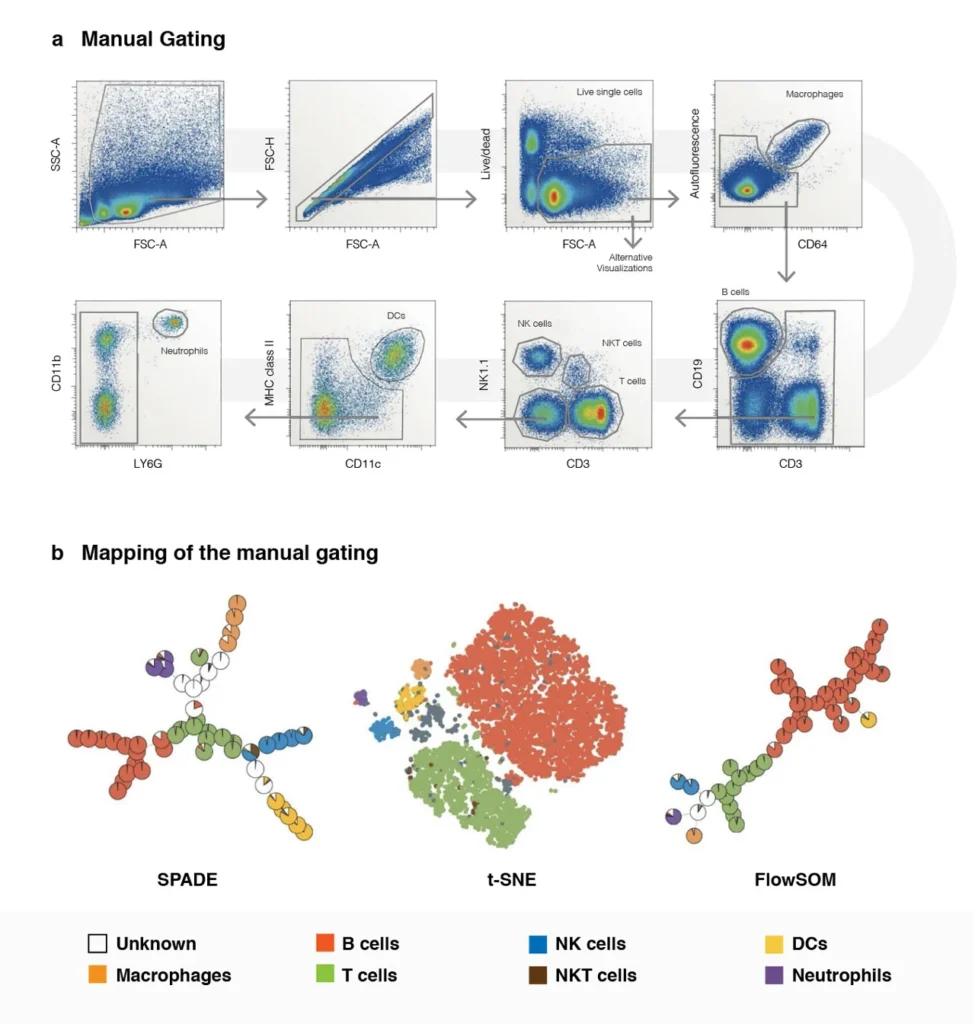
Figure 1. Utility of Using Computational Analysis Methods to Understand and Visualize the Complexity of High Dimensional Flow Data.
Panel A: Shows the visualization of high dimensional flow data using traditional flow cytometric data analysis methods on mouse splenocytes stained with 11 markers. Once the live cell population has need identified it takes an additional 5 plots to visualize and decipher the cellular subpopulations.
Panel B: Shows the power and utility of applying computational data analysis methods to the same high dimensional samples. Using the same gating strategy from Panel A (where we identify our live-cell-population) we can evaluate the same data using 3 different alternative algorithm-based techniques that reduce that data set from 5 plots down to one, thus showing that conventional approaches to data analysis does not scale well with an increased number of correlated measurements. The colors that are shown in these plots correlates to the manual gating results.
Adapted from Nature Review Immunology volume 16, pages 449-462 (2106)
Automated Approaches to Flow Cytometry Analysis
One significant challenge to the incorporation of flow cytometry into clinical trials is the time it takes to analyze data. This can be significant particularly in cases where actionable decisions are to be made based on the flow cytometry data. As well as drastically reducing the time for analysis, automated gating also addresses the challenges of analyst-specific subjectivity as well as the limitations of the intuitive manual approaches.
Various approaches to mitigate these barriers have been adopted, including the automation of gating to support an end-to-end analytical solution. Unsupervised approaches including cluster analysis (CA) and Principal Component Analysis (PCA) function by considering the fluorescence values of each single cell signature- there is no presumption on how the data will partition; they simply determine similarities and differences between samples. In the case of PCA, unsupervised dimensional reduction enables characteristics to be compared between samples, with minimum loss of information. This approach was used by Kalina et. al. to identify a specific cell population CD27–, CD24bright, CD38bright, CD19+ transitional B-cells that were specifically expanded in immunodeficient patients. It is unlikely that conventional gating would have readily revealed this population.
Both PCA and CA are useful for the simplification of polychromatic flow cytometry data sets and in the identification of differentially distinct cohorts within studies, that could be missed by classical hierarchical gating because of the high number of variables generated. These tools are therefore best implemented to identify trends and build models of predictive biomarker profiling and cellular responses within pre-clinical studies.
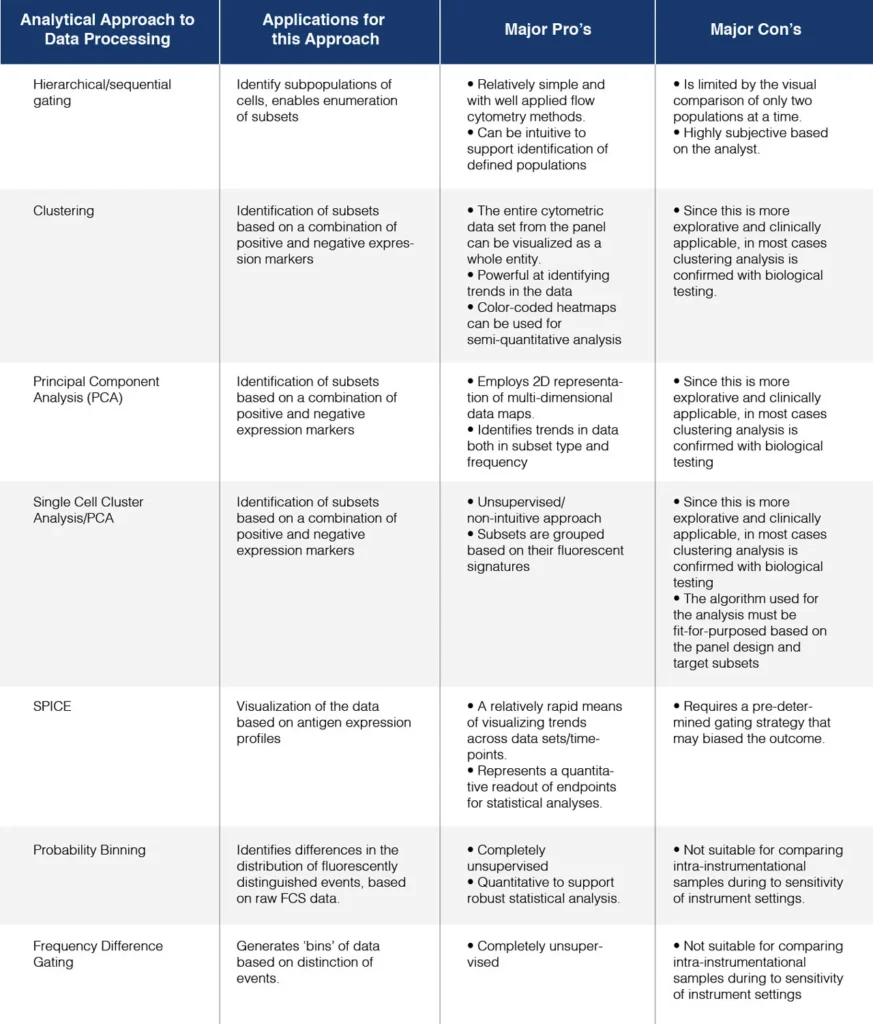
Table 1. Various approaches of the analysis of high complexity flow cytometry data. Adapted from Lugli et. al. 2010.
One of the major roadblocks to the widespread adoption of automated flow cytometry gating is the perception by the scientific community that these tools can be difficult to use, and that different clustering algorithms can result in inconsistent outcomes. As a result, the Flow Cytometry: Critical Assessment of Population Identification Methods (FlowCAP) project was founded to compare computational methods to assess the performance of automated algorithms to correctly identify subcellular populations, and make simple classifications associated with biomarker profiles (http://flowcap.flowsite.org/). This program has been instrumental in the evolution of optimal approaches of automated methods (Aghaeepour et. al. 2013) and program members, including Ryan Brinkman and his team are now making headway into clinical flow cytometry analysis (Montante and Brinkman 2019).
R-based Pipeline
R-based pipeline represents an end-to-end solution for the analysis of rare cell populations with lower frequencies. The concept uses Fluorescence Minus One (FMO) controls to play a critical role in gate positioning and assay performance by establishing thresholds for positive/negative expression of key markers. Attempts have been made to apply probability density functions from the FMOs to the fully stained samples, in order to position gates on rare cell populations. The platform’s simple modularity can be readily customized for various statistical analyses as well as enabling the incorporation of additional data sets into the same analytical data set (Fox et. al 2020)
Data Visualization
At its core, the analysis of multiparameter flow cytometry data is a process of finding structure in a high-dimensional space, therefore visualization is a powerful means of exploring data. This not only enables subsets of cells to be distinguished, but also opens the possibility of extracting layer upon layer of data in an unsupervised manner.
There are many open-source software applications that enable flow cytometry data to be visualized and mined, in a means that supersedes traditional hierarchical gating. One of the most popular, t-Stochastic Neighbor Embedding (t-SNE), an algorithm that arranges high-dimensional data points based on both their similarities and differences. In this regards, t-SNE differs from PCA which maximizes the separation of data points by identifying components which provide the greatest separation. t-SNE on the other hand assembles closely related data points in proximity. However, it is noteworthy that physical distances between clusters on a t-SNE map do not indicate how closely or distantly related those data points are to each other. t-SNE excels at resolving dim or non-discrete populations, but it is important to recognize that the algorithm relies heavily on MFIs, so this should be taken into consideration and appropriate calibration mechanisms used when applied to longitudinal clinical studies.
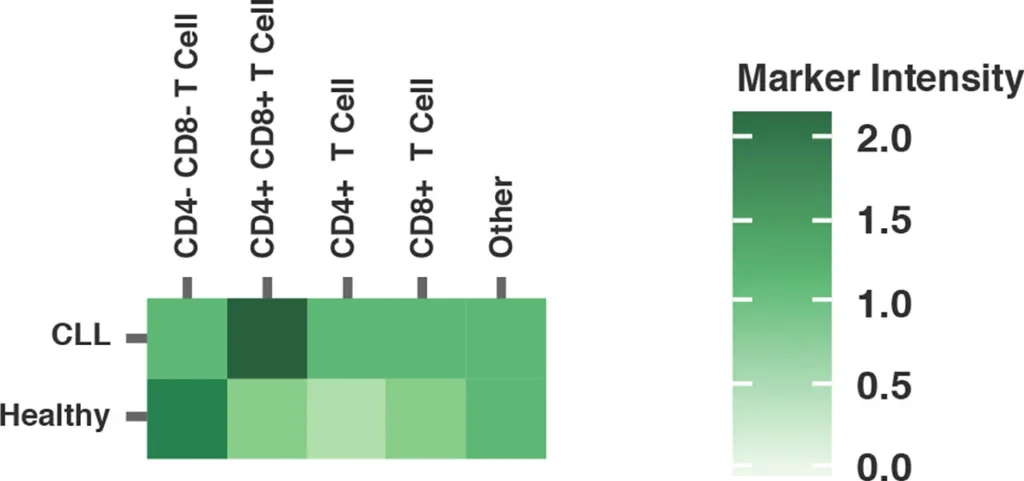
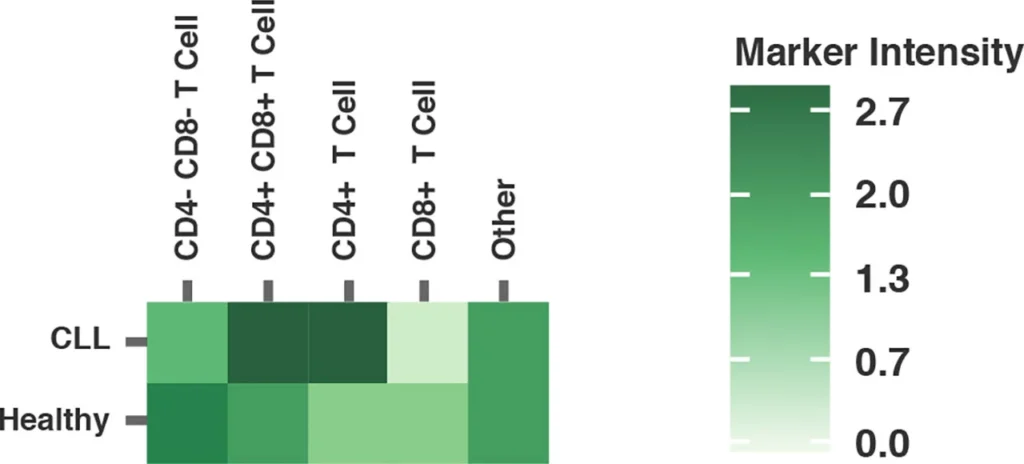
Heatmaps also provide a simple visualization of flow cytometry data, enabling users to readily identify the upregulation or downregulation of key markers between samples.
Fig. 2 summarizes a study comparing T-cell profiles from healthy controls with patients with CLL. Traditional hierarchical gating to demonstrate the comparison of expression of specific markers in CD4+ T-cells (A), CD8+ T-cells (B) from healthy and CLL donors. t-SNE analysis of the same samples provides a visual read-out of the differences between expression profiles between samples (C) CD4+ (D) CD8+. Heatmap analysis can be used to highlight populations driving the specific expression profiles for Ki67 (E) and Tim-1 (F).
(A)
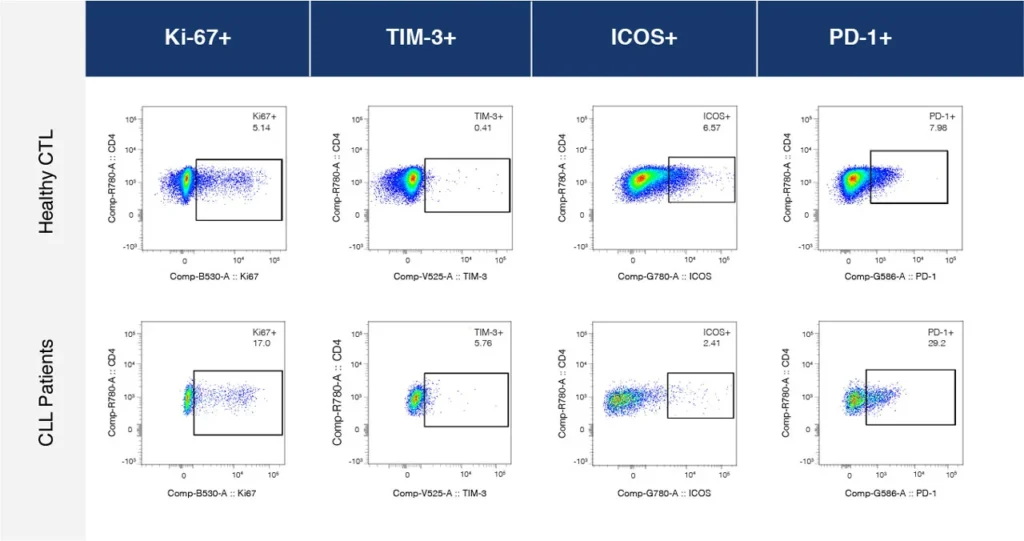
(B)
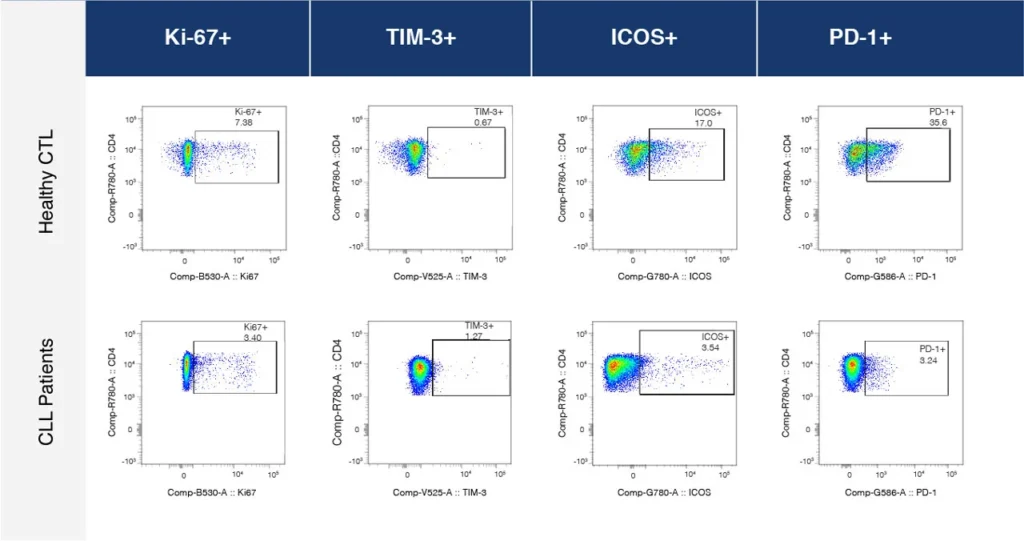
(C)
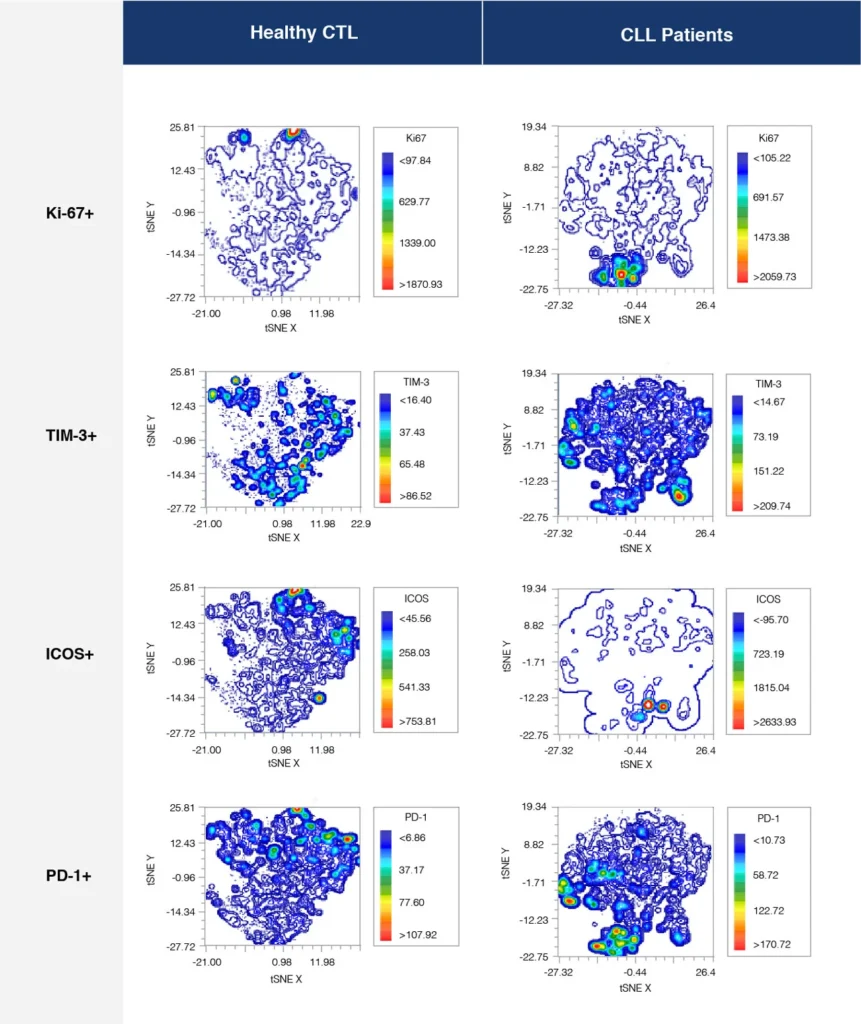
(D)
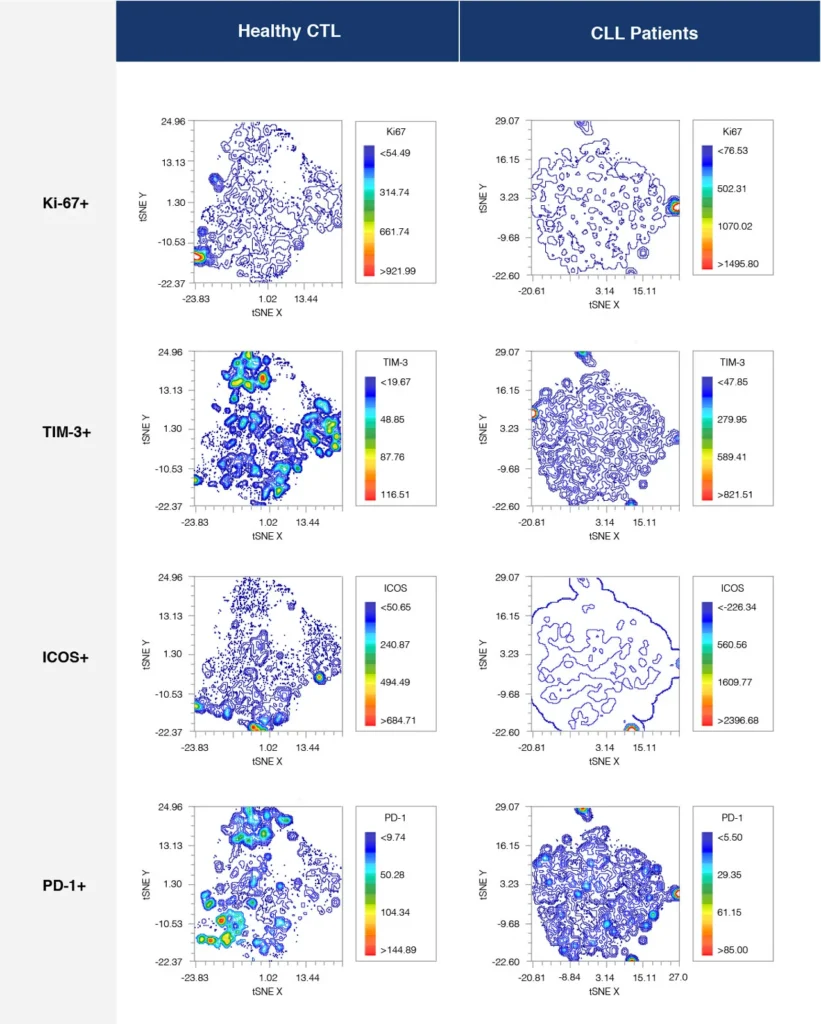
(E) Ki-67 Heatmap visualizing up or downregulation of Ki-67 within a comparison of healthy versus CLL samples
(F) Tim-3 Heatmap visualizing up or downregulation of Tim-3 within a comparison of healthy versus CLL samples.
Big Data Analysis Using Artificial Intelligence and Machine Learning
The current trends in data analysis software are shifting towards machine learning and statistical models to support automated population resolution. One such platform has been developed by Astrolabe Diagnostics which leverages Amazon Web Services, Bioinformatics and Machine Learning to expedite data analysis and perform data mining. The process takes the raw FCS files and runs unsupervised clustering, followed by differential abundance and expression profiling. Using the platform, it is possible to focus on statically significant variations between cohorts across limitless longitudinal studies, identify canonical populations and eliminate batch effects. FlowMetric is pleased to be offering the Astrolabe analytical platform as an add-on service for all of our sponsors running clinical trials.
Final Thoughts
For most clinical applications, manual gating is still the preferred method, but may be not for much longer. Stefan Krause recently wrote an excellent commentary for Cytometry A titled ‘On its Way to Primetime: Artificial Intelligence in Flow Cytometry Diagnostics’ that provides a comparison of AI-driven data analysis with conventional gating, in addition to identifying the outstanding limitations of the AI approach. The potential advantages of automated data analytics far outweigh the challenges and with flow cytometry now being used for clinical end-point determinations in trials, there is a growing need for speed, efficiency, and standardization of flow cytometry data analysis. More and more companies are developing end-to-end solutions that can support data transformation as well as provide a means of processing and reprocessing of the data within auditable pipelines. This is coupled with the promise of integration and annotation of multiple forms of clinical trial data, agnostic of the origin technology. Big data analytics will transform the way that clinical trials are performed, and new drugs evaluated. With so many of these new drugs acting through immune modulation, the adoption of clinical flow cytometry is growing rapidly so the adoption of tools to improve the efficiency and reproducibility of flow cytometry data analysis is a critical step.
Clinical trial sponsors are looking for data analytics solutions that enable them to take a deep dive into the data they collect and increase their confidence in the direction of clinical decisions based on this data for their trials, sites, and patients. Establishing platforms that enable data to be analyzed in close to real-time enables sponsors to have more control and avoid study delays, compliance issues or having to retroactively problem solve once a study is underway.
There is no doubt that the clinical trial industry is facing a shift toward more unified, integrated data analytics, and technologies that enhance this Big Data approach, with the potential to support data mining using AI will only continue to advance.
References
- Kalina T, Stuchly J, Janda A, Hrusak O, Ruzickova S, Sediva A, Litzman J, Vlkova M. Profiling of polychromatic flow cytometry data on B-cells reveals patients’ clusters in common variable immunodeficiency. Cytometry A. 2009;75A(11):902–9.
- Aghaeepour, N. et. al. Critical assessment of automated flow cytometry data analysis techniques. 2013 Nat. Methods 10(3): 228-238. PMCID: PMC3906045; NIHMSID: NIHMS436752; PMID: 23396282
- Montante, S. and Brinkman, R. Flow Cytometry data analysis: Recent tools and algorithms. International Journal of Laboratory Hematology. 2019 vol. 41 Issue S1 https://doi.org/10.1111/ijlh.13016
- Lugli, E. et. al. Data Analysis in Flow Cytometry: The Future Just Started. Cytometry A 2010 77(7): 705-13. PMCID: PMC2909632; NIHMSID: NIHMS215175; PMID: 20583274
- Fox, A. et. al. Cyto-Feature Engineering: A Pipeline for Flow Cytometry Analysis to Uncover Immune Populations and Associations with Disease. Scientific Reports 10, Article Number 7651 https://doi.org/10.1038/s41598-020-64516-0
- Krause, S. On its Way to Primetime: Artificial Intelligence in Flow Cytometry Diagnostics. Cytometry Part A 97A: 990-993, 2020. DOI: 10.1002/cyto.a.24191